
Sample report
This is the full output of one PlotDossier run on a sample batch of 14 fictitious plots (Colombia, Ethiopia, Türkiye). Names and boundaries are invented; the satellite and forest data are real.
SAMPLE DATA – fictitious plots for demonstration only.
Results of the sample batch
14plots received
11passed the TRACES geometry check
3returned with a correction (hole, self-intersection, point for a 6 ha plot)
6 / 6 / 2LOW / REVIEW / HIGH
LOW REVIEW HIGH
Inside the report
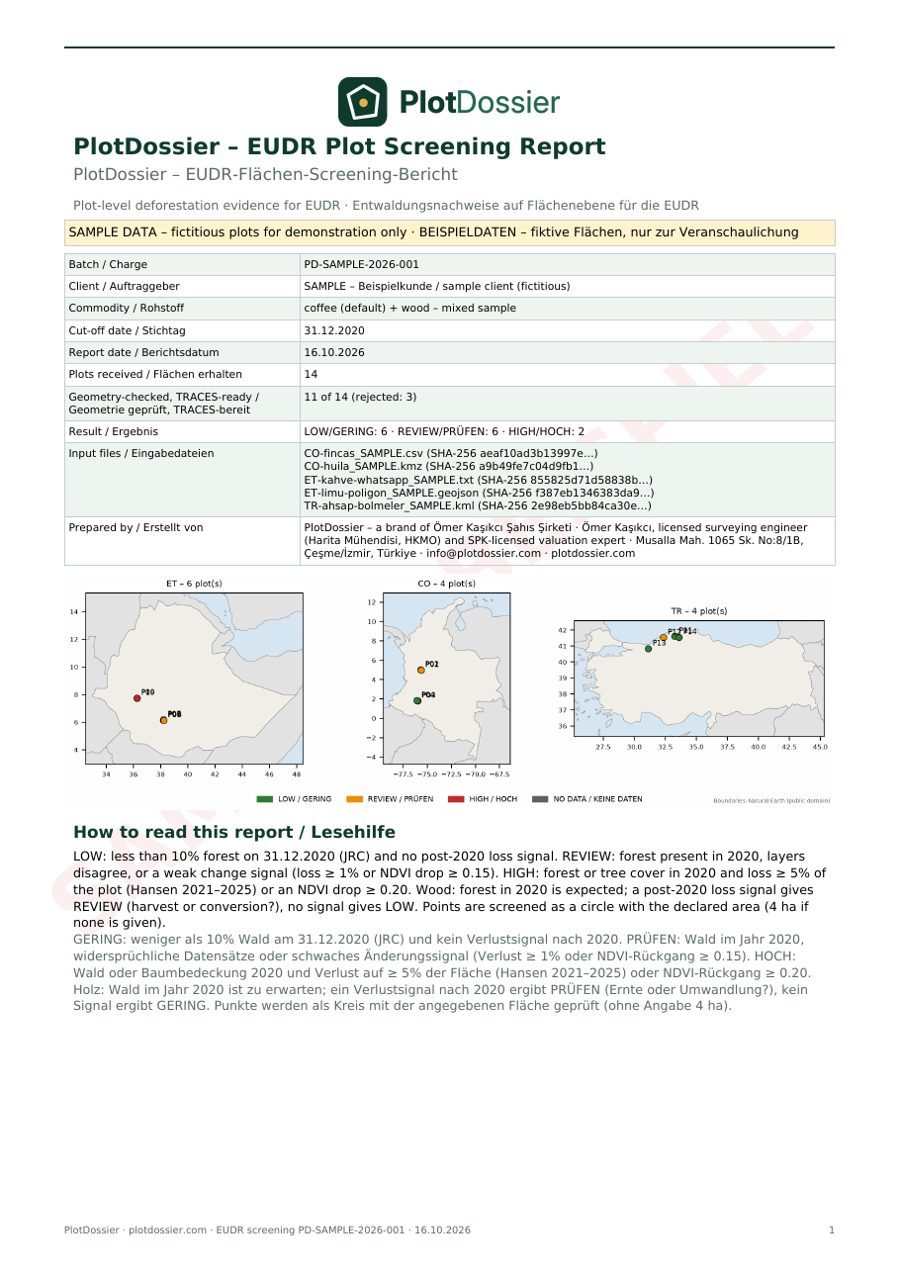
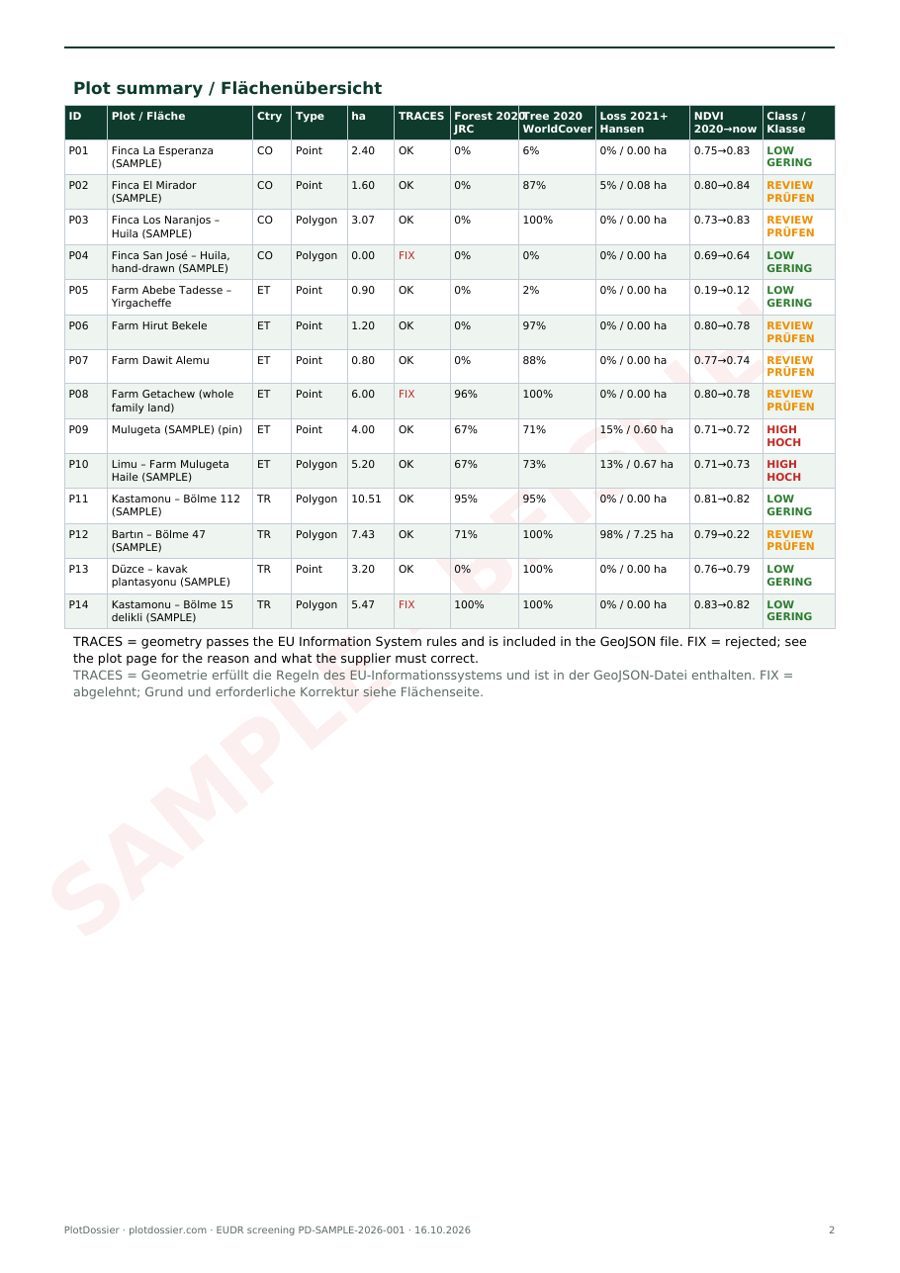
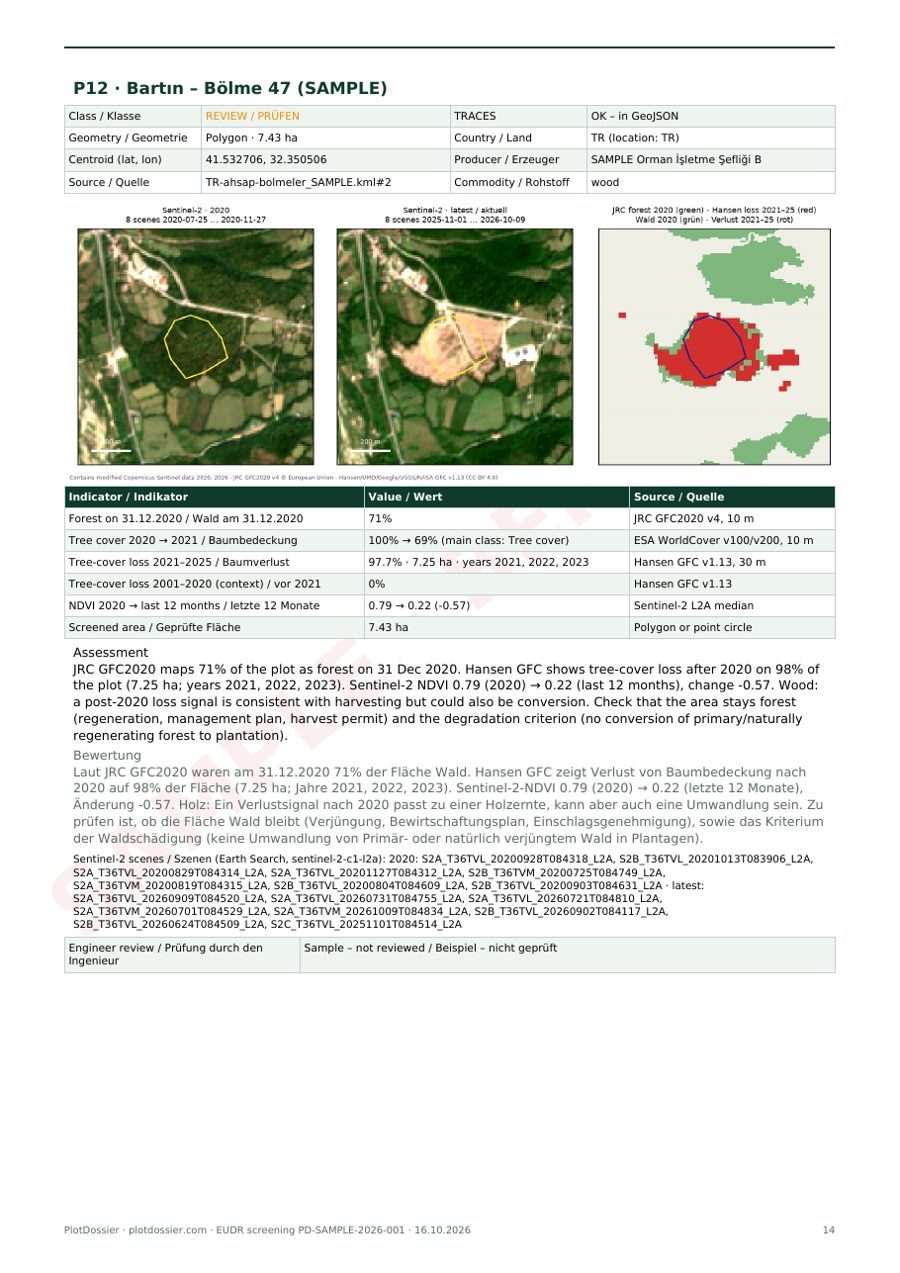
Example: a REVIEW plot
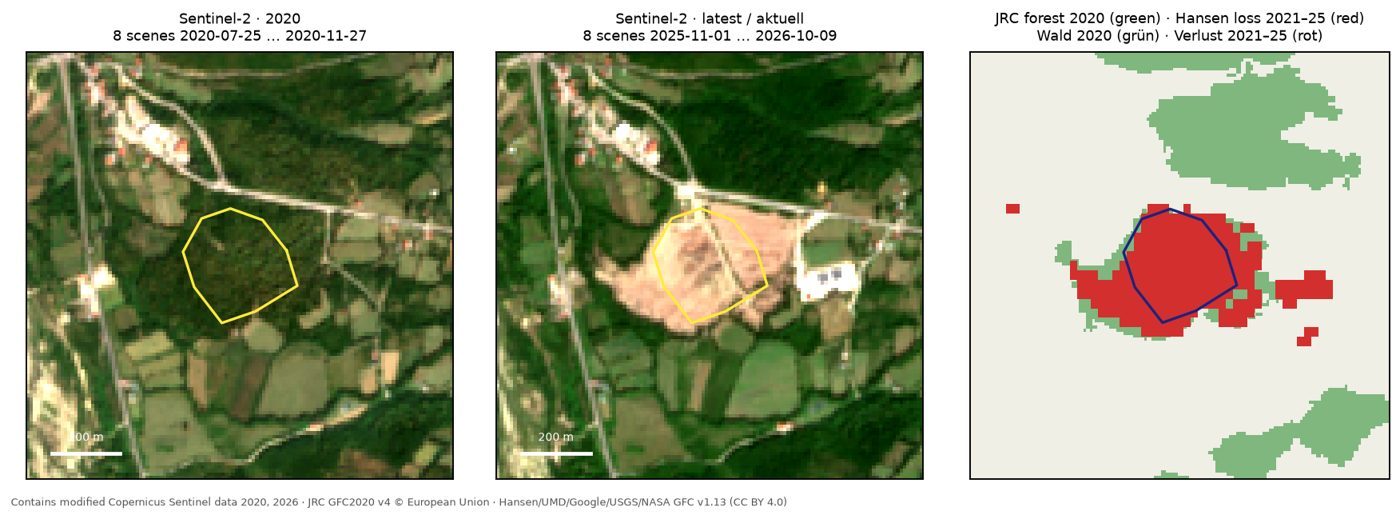
Bartın – Bölme 47 (fictitious wood plot, 7.4 ha): 71 % forest in 2020 (JRC), tree-cover loss on most of the plot in 2021–2025 (Hansen), NDVI dropped from 0.79 to 0.22. For wood a loss signal is flagged REVIEW, not HIGH, because regular harvesting with replanting is not deforestation – the operator should file the harvest permit and confirm that the area stays forest.
Try PlotDossier with three plots
Send three plots from one supplier. Within two working days you receive the geometry check, the risk flags and a short PDF report – free and without obligation.